By Kezia Royer-Burkett, Local Journalism Initiative Reporter
A report from an online insurance comparison platform recently ranked Burlington as the second most dangerous city to drive in Ontario, but local officials say the finding may not reflect the city’s actual collision data.
On Feb. 26, 2026, insurance comparison platform MyChoice published a report titled Top 10 Safest and Most Dangerous Cities for Driving in Ontario in 2026, ranking Toronto as the safest city and Burlington as the second most dangerous.
After being contacted by Burlington Local-News.ca, the company explained that its research does not rely on official collision data. Instead, the analysis is based on more than 200,000 insurance quote requests submitted between 2020 and 2025, including drivers’ self-reported accident and infraction histories.
“Our analysis instead looks at the percentage of drivers who have accidents or infractions on their record,” the company said in a statement, noting that the data represents an insurance risk perspective rather than a count of all collisions occurring within a municipality.
The ranking has also been reported by a number of news outlets, so readers searching for Burlington traffic safety may encounter headlines describing the city as one of Ontario’s most dangerous places to drive. However, this characterization may not be accurate.
Collision statistics from the Ontario Ministry of Transportation tell a more complex story. According to the Ontario Road Safety Annual Report, Burlington recorded 1,505 collisions in 2022. In comparison, Brampton recorded approximately 9,060 collisions, while Toronto recorded more than 32,000 during the same year.
Population differences between cities must be considered, but even when collisions are calculated per capita, Burlington does not rank among the province’s highest collision rates. Using 2022 population estimates and the 2022 Ontario Road Safety report, Brampton had approximately 1,208 collisions per 100,000 residents, Toronto about 1,081 per 100,000, and Brantford about 1,258 per 100,000 residents.
And Burlington? Approximately 805 collisions per 100,000 residents.
Ward 5 Councillor Paul Sharman says the methodology makes it difficult to determine whether the ranking accurately reflects driving conditions in Burlington.
“Well, what we understand is that this is a report produced from insurance data,” Sharman said. “We don’t even know who MyChoice is, and if it’s coming from insurance data, the question is whether that recording is based on where people live versus where they actually had an accident.”
He added that city staff have also struggled to interpret the findings.
“So we just don’t know what that data represents truthfully,” Sharman said. “I had a conversation with city staff about that, and they said, ‘We don’t know what it is.’ We don’t have any way to demonstrate or prove whether it’s right or wrong.”
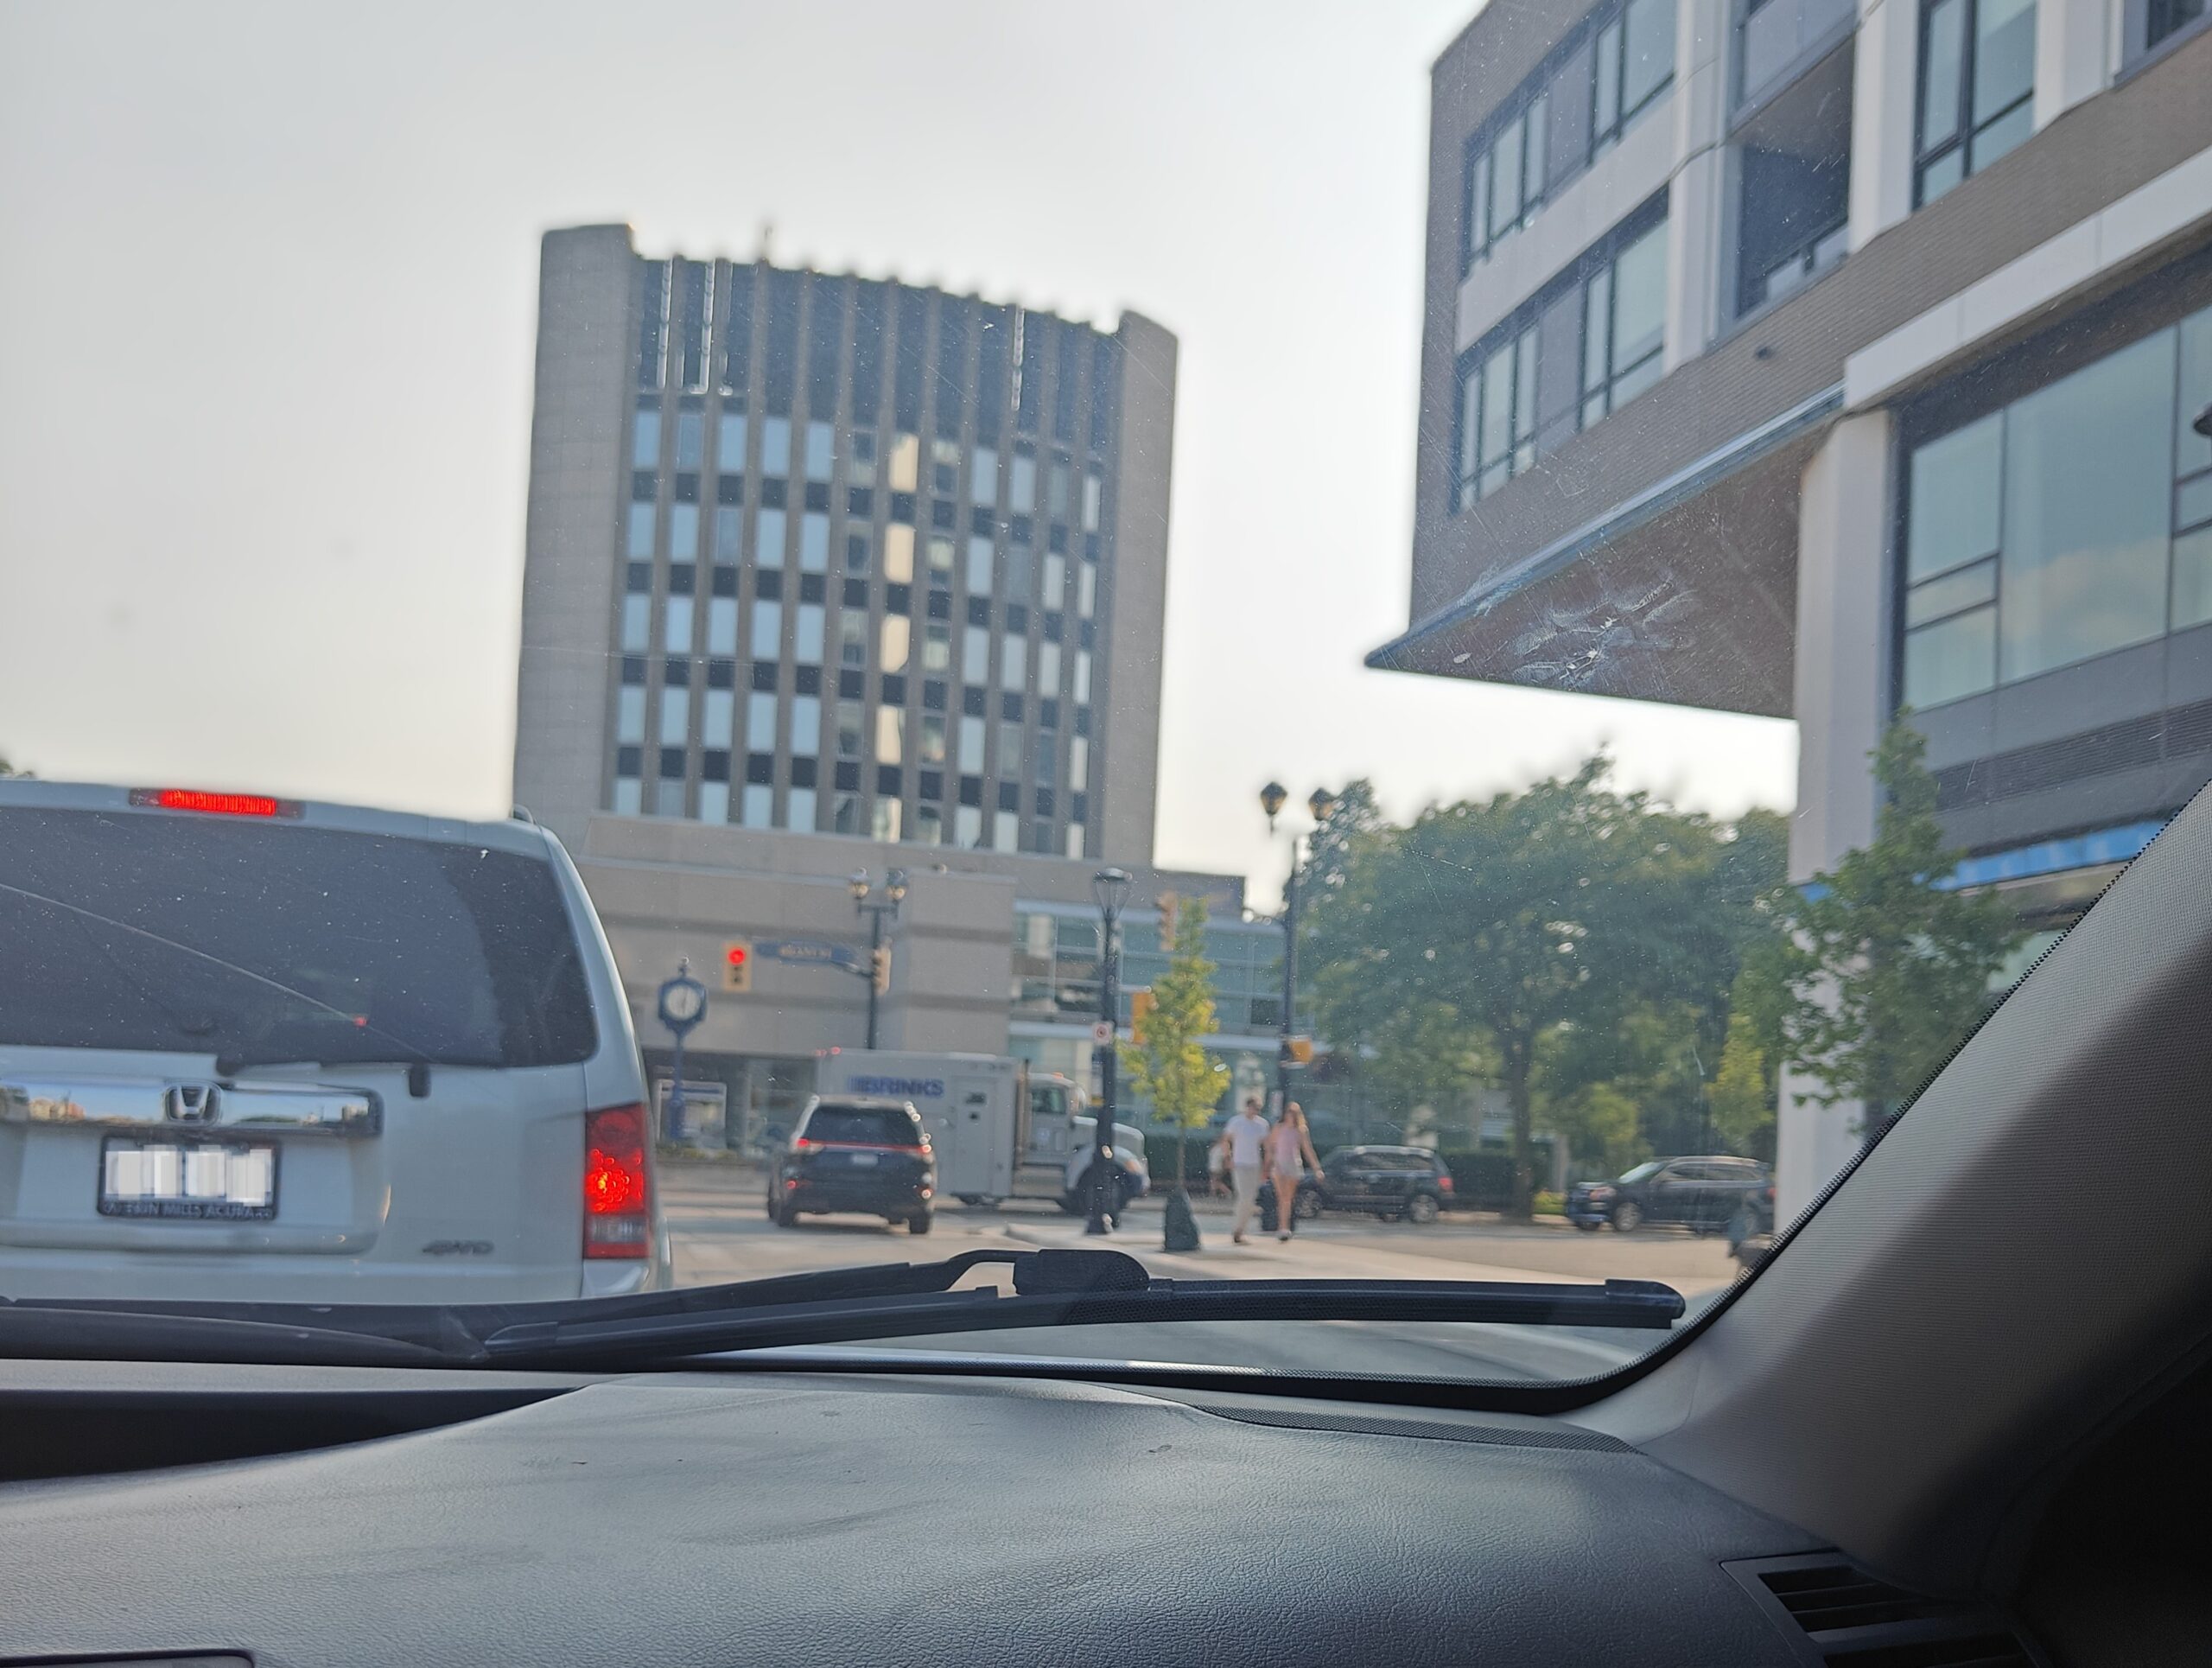
Despite questions about the report’s conclusions, traffic congestion remains one of the most common concerns raised by residents in Burlington.
Sharman says the city has faced an especially difficult period in recent years due to major highway maintenance affecting traffic flow.
“We have had the Skyway bridge being closed, especially in the summer, for maintenance,” he said. “That has taken what was already a very troubled, busy downtown and an entire city being clogged up most evenings at peak hour to being a downright nightmare.”
The situation is compounded by drivers leaving the highway when congestion builds, pushing additional traffic into local neighbourhood streets.
“The highway gets blocked up every night,” Sharman explained. “People get off the highway coming west at Third Line and Burloak and then jam up our streets from that point on for about three hours.”
Growth and development have also contributed to concerns about future congestion.
“To make matters worse, there are new buildings always being proposed, and the threat of those being built adds to local traffic,” he said.
Sharman also believes the structure of Burlington’s transit system discourages many residents, particularly older adults, from using public transportation.
“Our transit system is defined by large buses and fixed routes,” he said. “A lot of people would not be driving if they had a convenient on-demand transit system, but they don’t have that option.”
He noted that Burlington has roughly 12,000 residents over the age of 75, yet daily transit ridership averages only a few thousand people.
“Older adults are not going to walk to a bus stop, especially in cold weather or hot weather,” he said.
Sharman has suggested exploring smaller, on-demand electric vehicles operating within neighbourhoods to provide more flexible transportation options for seniors and others who currently rely on cars.
For now, city officials are seeking public input as they consider ways to address congestion and transportation challenges.
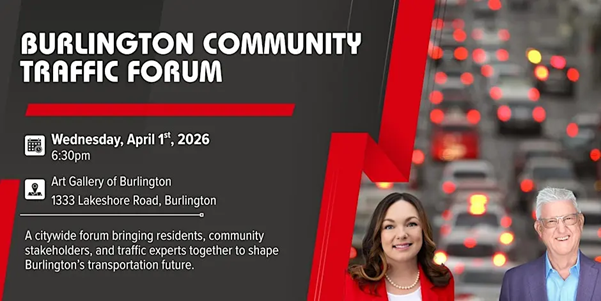
Sharman and Ward 2 Councillor Lisa Kearns will host a Burlington Community Traffic Forum on April 1 from 6:30 p.m. to 9 p.m. at the Art Gallery of Burlington. The event will bring together representatives from the Halton Regional Police Service, Burlington Transit, the city’s transportation department, and other stakeholders to discuss solutions.
While debate continues over how Burlington compares to other municipalities for driving safety, Sharman says one thing is clear: residents want action on traffic.
“The thing that we get asked about the most when we have community meetings is traffic congestion,” he said. “That’s why conversations like this are particularly important.”